
The Weather can affect trading patterns in hospitality, including overall sales and Product performance. Oolio One Back Office reports include weather data alongside sales information to help compare trading performance with temperature and rainfall conditions.
Weather information is available across many reports and is also used in Forecast and Budget Planning.
Understand weather data
The Weather data is based on information available within a radius of no more than 50 km from the address configured for the Location.
For the most relevant weather information, make sure the address configured for each Location is correct.
The temperature and rainfall displayed depend on the selected reporting period:
- One day: Displays the temperature and rainfall for the selected date.
- Date range: Displays average temperature and rainfall across the selected period.
Add weather data to a report:
-
Weather fields can be added to supported Insights reports from the report's field selector.
- Open the required report.
- Select the required date range and Locations.
- Scroll to the data grid.
- Open the field selector.
- Select the required Weather fields.
- Remove any fields that are not required.
-
Scroll horizontally across the data grid where required to view all selected fields.
The Sales Summary report:
-
Open Insights > Sales Summary, then add the required Weather fields to the data grid.
-
When Weather fields are added, the report defaults to Group by Store.
-
Change the report filters or Group By option to view the information differently. For example, group the report by day to compare daily sales with temperature and rainfall.
The Hourly Sales report:
-
Add Weather fields to the Hourly Sales report to compare hourly sales with weather conditions.
-
The data grid displays sales by hour. Weather information displays the values for a selected date or averages when a date range is selected.
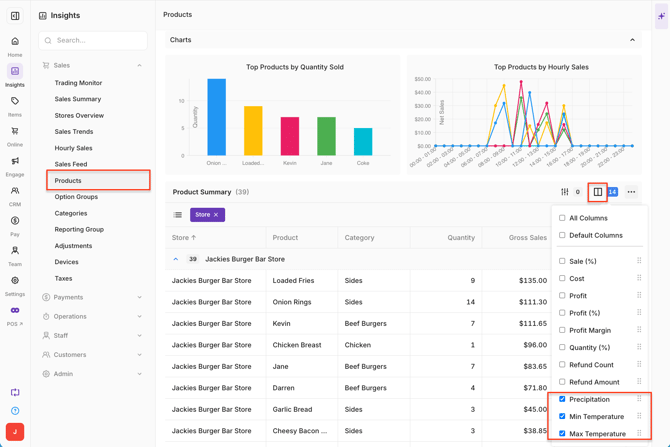
The Product Report:
-
Add Weather fields to the Product Report to compare Product sales with weather conditions.
-
This can help identify differences in Product performance across different temperatures or rainfall conditions.
-
Historical dates can also be selected to review Product performance and weather conditions for a particular trading period or event, such as Mother's Day.
Other reports with weather data:
-
Weather fields are also available in:
- Option Groups
- Categories
- Reporting Group
- Adjustments
- Devices
-
Use the report filters and field selector to display the required sales and Weather information.
Weather in Forecast and Budget Planning:
-
Weather information is also integrated with Forecast and Budget Planning to support sales forecasting and budget planning.