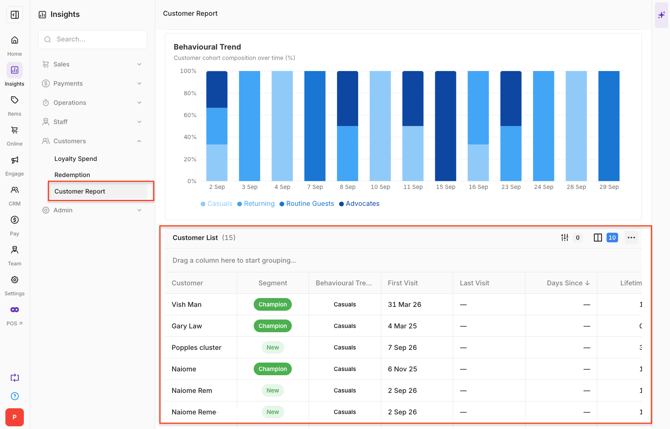
The Customer Report in Oolio One Insights provides information about customer spending, visit frequency and repeat behaviour. Use the report to understand customer segments, compare their contribution to traffic and revenue, and review visit patterns for identified customers.
The report includes Customer Segmentation and Visit Frequency views for analysing different aspects of customer behaviour.
Before starting
Confirm:
- Loyalty is enabled for the Location.
- IdentifiedSufficient customer transaction history has been collected. New Locations may have limited information until more transactions are recorded.
Open the Customer Report
Open the Customer Report in Oolio One Insights.
-
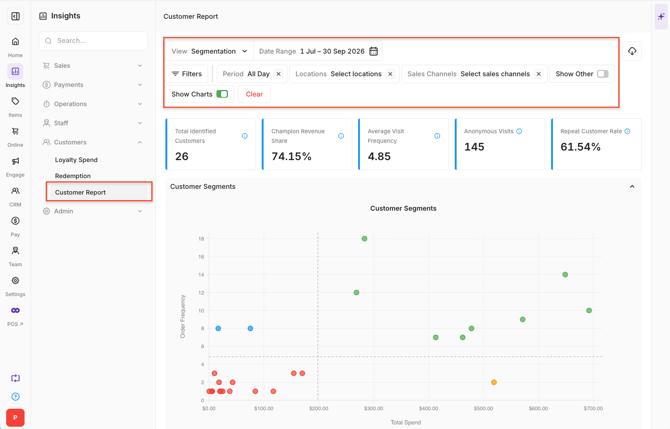
Use the filters at the top of the report to select:
- Location: Select a specific Location where required.
- Period: Select the last 7, 30 or 90 days.
- Custom Date Range: Select a specific start and end date.
- Sales Channel: Filter by the required Sales Channels.
Understand Customer Segmentation
The Customer Segmentation view groups identified customers based on their spending and visit frequency.
-
Customers are grouped into four segments:
- Champions: Higher spend and higher visit frequency.
- Regulars: Lower spend and higher visit frequency.
- Occasionals: Higher spend and lower visit frequency.
- Drifters: Lower spend and lower visit frequency.
-
Transactions that are not linked to a customer profile are classified as Other (Anonymous).
Review Customer Segmentation metrics
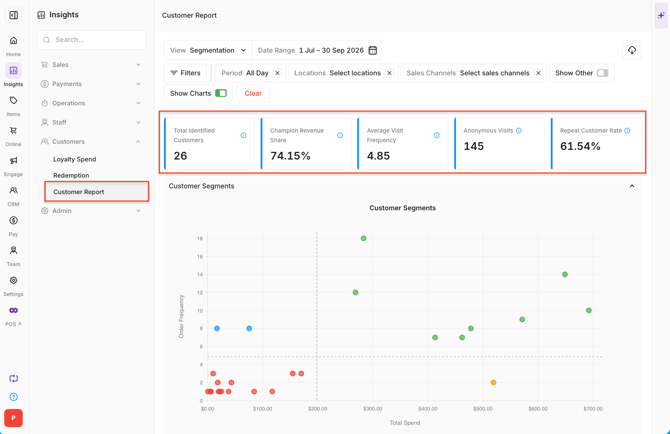
The summary metrics provide an overview of the selected customer data:
- Total Identified Customers: Number of distinct customers classified into a customer segment.
- Champion Revenue Share: Revenue generated by Champions as a percentage of total revenue.
- Average Visit Frequency: Total visits divided by total identified customers.
- Anonymous Visits: Transactions that are not linked to a customer profile.
- Repeat Customer Rate: Customers with more than one visit as a percentage of total identified customers.
Understand the Customer Value Matrix
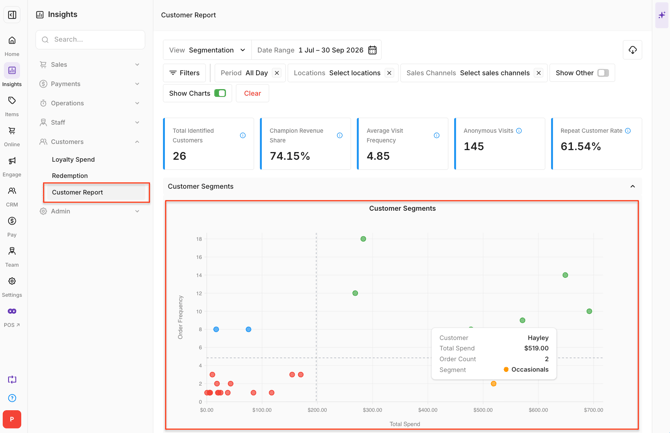
The Customer Value Matrix displays identified customers according to spending and visit frequency.
-
Each point represents a customer:
- The horizontal axis represents Total Spend.
- The vertical axis represents Normalised Visit Frequency.
-
The four areas of the matrix represent:
- Champions: Higher spend and higher frequency.
- Regulars: Lower spend and higher frequency.
- Occasionals: Higher spend and lower frequency.
- Drifters: Lower spend and lower frequency.
-
Hover over a customer to view their name, Total Spend, Visit Frequency and segment.
Review traffic and revenue by customer segment
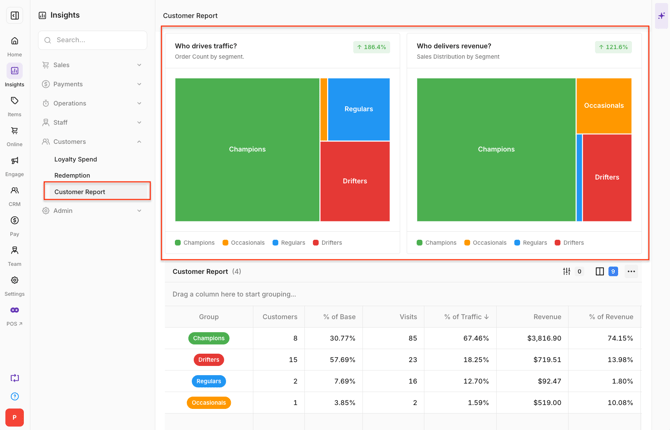
Two nested charts show how each customer segment contributes to traffic and revenue:
- The charts show:
- Who drives traffic?: Tile size represents the segment's share of total orders.
- Who delivers revenue?: Tile size represents the segment's share of total revenue.
-
The Segment colours are:
- Champions: Green
- Occasionals: Orange
- Regulars: Blue
- Drifters: Red
- Other: Grey
-
Other (Anonymous) is hidden by default. Select it from the legend to include transactions that are not linked to a customer profile.
Review Customer Segment data
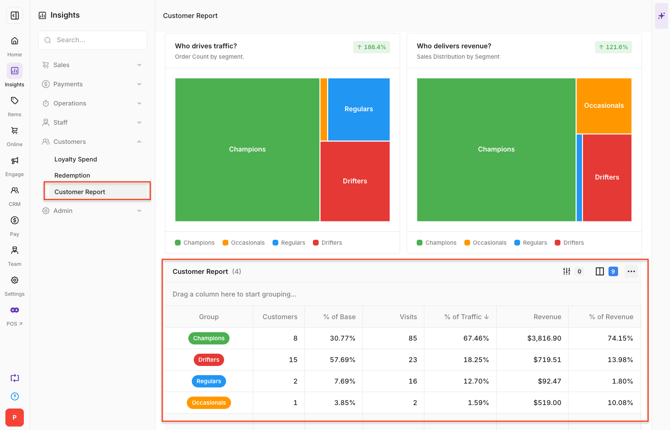
The Customer Segment data grid provides detailed information for each segment
-
Including:
- Segment
- Customers
- % of Base
- Visits
- % of Traffic
- Revenue
- % of Revenue
- Avg Spend
- Avg Visits
-
Use the options (⋯) filter to filter the grid using the available fields.
-
For example, filter Group by values beginning with C to display Champions.
Understand Visit Frequency
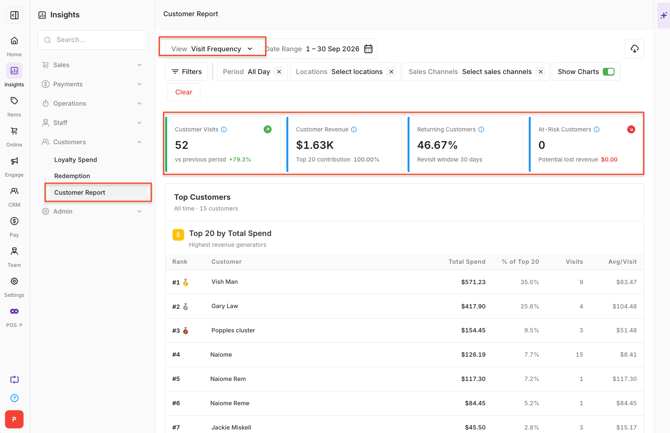
Select the Visit Frequency tab to review customer visits and changes in visit behaviour.
-
The summary cards display:
- Customer Visits
- Customer Revenue
- Returning Customers
- At-Risk Customers
-
At-Risk Customers are Drifters who have not visited recently.
Review Top Customers
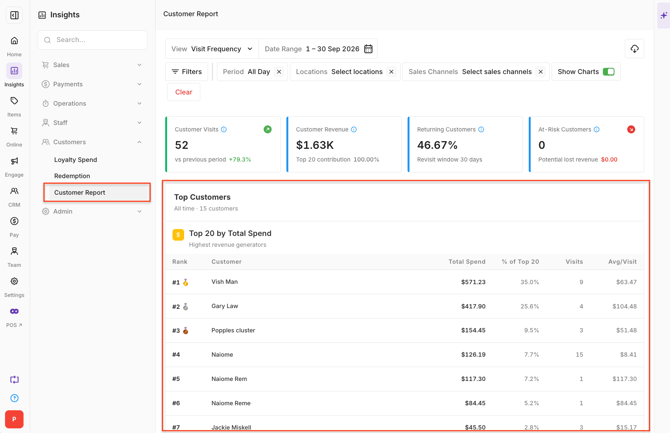
The Top Customer tables provide information about customers with the highest spending and visit frequency.
-
Use the tables together to compare customer value and visit behaviour.
Understand Customer Behaviour Trends
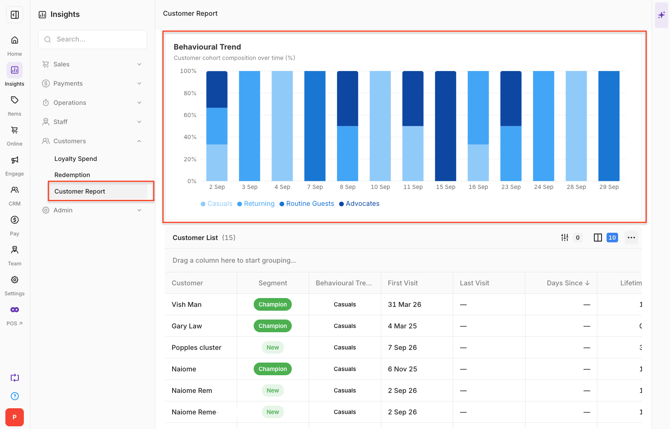
The Customer Behaviour Trend chart groups customers according to visit frequency:
-
They are:
- Casuals: 1 visit
- Returning: 2–3 visits
- Routine Guests: 4–6 visits
- Advocates: 7 or more visits
-
For a single day, the information is displayed as a standard bar chart.
-
For periods of three or more days, the Multi-Day View displays a 100% stacked bar chart showing the share of each customer group over time.
-
Hover over a section of the chart to view the customer group, percentage and customer count.
Review Customer Details
The Customer Details grid provides customer-level information for identified customers.
-
The grid includes:
- Customer
- Group
- First Visit
- Last Visit
- Total Visits
- Days Since Last Visit
- Lifetime Frequency
- Last 90d Frequency
- Guest Visit Prediction
-
Use the filter icon to filter customers using any of the available fields.
Note: Guest Visit Prediction requires at least two recorded visits. No prediction is displayed when only one visit is recorded for a customer.